Gujarat Board Solutions Class 10 Maths Chapter 14 Statistics Ex 14.2
Gujarat Board Solutions Class 10 Maths Chapter 14 Statistics Ex 14.2
Gujarat Board Textbook Solutions Class 10 Maths Chapter 14 Statistics Ex 14.2
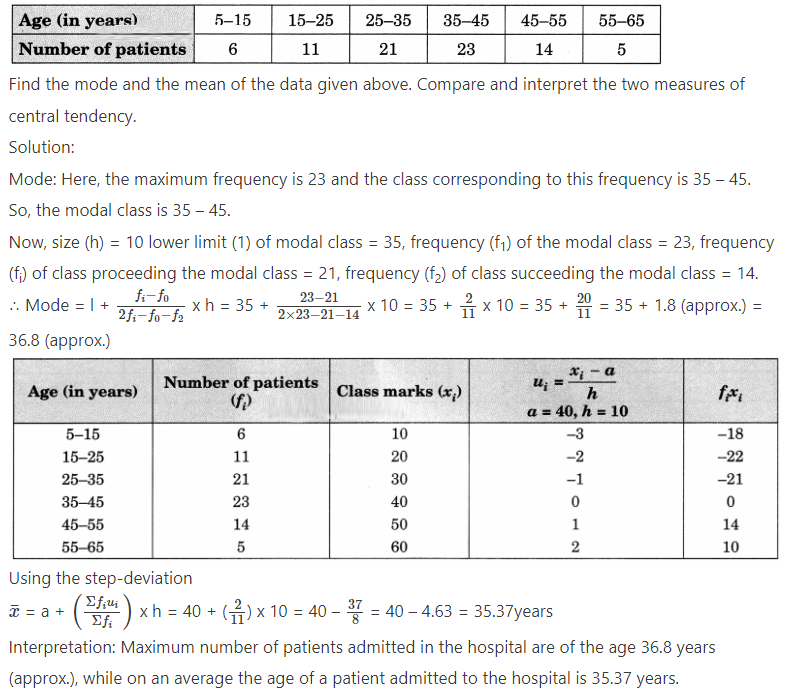
Question 1.
The following table shows the ages of the patients admitted in a hospital for a year.
Question 2.
The following data gives information on the observed lifetimes (in hours) of 225 electrical components.

Question 3.
The following date gives the distribution of total monthly expenditure of 200 families of a village. Find the modal monthly expenditure of the families. Also, find the mean monthly expenditure.


Question 4.
The following distribution gives the state-wise teacher-student ratio in higher secondary schools of India.

Find the mode and mean of this data. Interpret, the two measures
Solution:
Mode: Since the maximum number of states/UT have the number of students per teacher in the interval 30-35, the modal class is 30-35.
Therefore, l = 30, h = 5, f1 = 10, f0= 9, f2 = 3

Question 5.
The given distribution shows the number of runs scored by some top batsmen of the world in one-day international cricket matches.

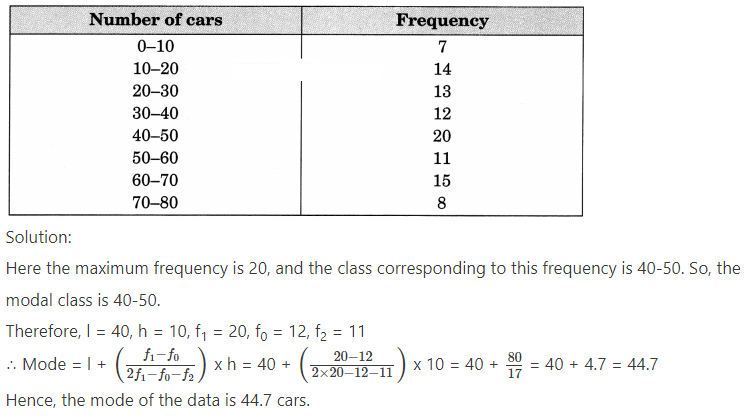
Question 6.
A student noted in the number of cars passing through a spot on a road for 100 periods each of 3 minutes and summarised it in the table given below. Find the mode of the data:
Follow on Facebook page – Click Here
Google News join in – Click Here
Read More Asia News – Click Here
Read More Sports News – Click Here
Read More Crypto News – Click Here