JKBOSE 9th Class Social Science Solutions Chapter 6 Population
JKBOSE 9th Class Social Science Solutions Chapter 6 Population
JKBOSE 9th Class Social Science Solutions Chapter 6 Population
Jammu & Kashmir State Board JKBOSE 9th Class Social Science Solutions
J&K class 9th Social Science Population Textbook Questions and Answers
MAIN POINTS
● Manpower—A human resource.
● Total Population of India (2011)—121.02 crores.
● Average density of population (2011)— The second largest populated country of the world.
● The State with highest density of population—382 persons per sq. km.
● The State with lowest density of population—Bihar (1106 persons per km².)
● The Union Territory with highest density of population—Arunachal Pradesh (17 persons per km²).
● The state having largest population—Delhi. (11320 persons per sq. km.)
● Rate of growth of population during 2000-2010—U.P. (20 crores persons approx.)
● The state with highest rate of growth of population—17.3%.
● The state with lowest rate of growth of population—Meghalaya (27%).
● Percentage of urban population in India—Kerala (4%).
● Total urban population—31.2%.
● The state with highest % of urban population—37 crores.
● Number of million towns (2001)—53.
● Average sex ratio in India (2001)—940 females per 1000 males.
● Highest sex ratio in India—Kerala (1084 females per 1000 males.)
GEOGRAPHICAL TERMS
1. Birth rate : Number of live births per 1000 people in a year.
2. Death rate : Number of deaths in a year per 1000 people.
3. Life expectancy : Average age the people of a country expected to live.
4. Sex Ratio : Number of females per 1000 males.
5. Census : The count of population of a country after 10 years.
6. Migration : Movement of people from one area to another.
7. Density of population : The average number of persons per sq. unit area.
8. Demography : Study of population of a country.
9. Literacy : Percentage of people who can read and write in any language.
10. Population growth : Change in the number of people of an area during a period.
TEXTUAL QUESTIONS
Q.1. Choose the right answer from the four alternatives given below :
(i) Migrations change the number, distribution and composition of the population in :
(a) the area of departure
(b) the area of arrival
(c) both the area of departure and arrival
(d) none of the above
Ans.— (c) both the area of departure and arrival.
(ii) A large proportion of children in a population is a result of :
(a) high birth rates
(b) high life expectancies
(c) high death rates
(d) more married couples
Ans.— (a) high birth rate.
(iii) The magnitude of population growth refers to :
(a) the total population of an area
(b) the number of persons added each year
(c) the rate at which the population increases
(d) the number of females per thousand males.
Ans.— (b) the number of persons added each year.
(iv) According to the census, a ‘literate’ person is one who :
(a) can read and write his/her name
(b) can read and write any language
(c) is 7 years old and can read and write any language with understanding
(d) knows the 3 R’s (reading, writing, arithmetic)
Ans.— (c) is 7 years old and can read and write any language with understanding
Q. 2. Answer the following questions briefly.
(i) Why is the rate of population growth in India declining since 1981 ?
Ans.— The rate of population growth in India is declining since 1981, on account of the following reasons:
(a) Better healthcare facilities provided by the government.
(b) A sharp decline in birth as well as in death rates.
(ii) Discuss the major components of population growth.
Ans.— Population growth depends upon the following components : (a) Birth rate (b) Death rate (c) Migration.
(a) Birth rate is the number of live births in a year per 1000 of the population of an area. At present, the birth rate in India is 21.8.
(b) Death rate is the number of deaths in a year per 1000 of the population of an area. At present, the death rate of India is 7.1.
(c) Migration refers to the process of moving from one place to another, permanently or for a longer period of time. It affects the change in number of distribution and composition of the population both in the area of departure and arrival.
(iii) Define age structure, death rate and birth rate.
Ans.— Age Structure. It refers to the division of population into three categories of age groups. These categories are :
(a) Change in the age-group of below 15 years.
(b) Adults or working population in 15-65 years of age group.
(c) Old group in the age group 65 year and above.
Birth rate. It refers to the number of live births in a year per 1000 of the population of an area. At present, the birth rate in India is 21.8.
Death rate. It refers to the number of deaths in a year per 1000 of the population of an area. At present the death rate of India is 7.1.
(iv) How is migration a determinant factor of population change ?
Ans.— Migration means the movement of people across areas. It can be internal as well as external. Migration from rural areas takes place due to rising population and the lack of demand for agricultural labour. Moreover, cities offer better amenities, infrastructure, better standard of living and better economic opportunities.
Q. 3. Distinguish between population growth and population change.
Ans.—
| Population Growth | Population Change |
| (i) It is the change in the number of people in a country in a particular period of time. | (i) It is the increase, decrease or constant level of population of a place for one year. |
| (ii) It is expressed as absolute numbers and percentage. | (ii) It is expressed in percentage. |
| (iii) It is affected by economic development and immigration. | (iii) It is affected by birth rate, death rate and immigration. |
Q. 4. What is the relation between occupational structure and development ?
Ans.— Occupational structure refers to the distribution of its people according to different occupations. Primary occupations include agriculture, animal husbandry, forestry and fishery. Manufacturing is a secondary occupation. Tertiary occupations include transport, communication, banking, service, etc.
Q. 5. What are the advantages of having a healthy population ?
Ans.— Manpower is a vital resource of a country. The human resources or number of people constitute its manpower. Manpower exploits the natural resources of a country. Sparse population is a hindrance in the development of some countries. But manpower is not assessed in human number alone. Manpower is assessed by the quality of the people. An interaction between man and his environment results in the utilisation of resources. Thus, the economic standard of a country is raised. Manpower must be educated, efficient, skilled and gifted with scientific knowledge. Healthy, hardworking, capable and energetic people make the real manpower. Such manpower produces more and increases the gross national production of a country. Hence, manpower is assessed in terms of quality and not in quantity.
Q. 6. What are the significant features of the National Population Policy 2000 ?
Ans.— National population policy was implemented in year 1952. Its main objectives are to :
(i) Promote the economic and social development of the country and improve the quality of life of people.
(ii) To enhance their well-being and to provide them with opportunity and choices to become productive assets in society.
(iii) Death rate is to be reduced. Family planning and birth control measures are to be used.
The National Population Policy (NPP) aims at stabilising population by 2045. It lays emphasis on economic growth, social development, and environmental protection. Certain measures which are to be adopted for it are :
(i) Raising the
age of marriage.
(ii) Making school education up to age of 14 years free and compulsory.
(iii) Reducing dropouts at primary and secondary levels.
PROJECT/ACTIVITY
Conduct a class census by preparing a questionnaire. The questionnaire should contain minimum five questions. Questions should relate to students, their family members, their class performance, their health etc. Each student is required to fill up the questionnaire. Compile the information in numerical terms (in terms of percentage). Present the information through pie-chart, bar-diagram or in any other way.
Ans.— Try it yourself with the help of your teacher. Guideline for preparing a questionnaire :
| Student can prepare a questionnaire on the guidelines given below : |
| Name of the head of the family | |
| Name of members in your family | |
| Number of employed, self employed and unemployed members | |
| How many members of your family have fallen ill in the last year | |
| Number of family members taking medicine regularly | |
| What is your rank in the class ? |
A similar questionnaire can be prepared by asking such questions. Students should complete it at their own end.
OTHER IMPORTANT QUESTIONS
Objective Type Questions
I. Multiple Choice Questions
Choose the right answer out of the four alternatives :
Q. 1. According to 2011 census, the total population of India.
(i) 121.02 crores
(ii) 68.38 crores
(iii) 60.10 crores
(iv) 54.10 crores.
Ans.— (i) 121.02 crores.
Q. 2. The average density of population India (2011) is per km.
(i) 216
(ii) 316
(iii) 221
(iv) 382.
Ans.— (iv) 382.
Q. 3. Which state has the largest population ?
(i) U.P.
(ii) West Bengal
(iii) Kerala
(iv) Punjab.
Ans.— (i) U.P.
Q. 4. Which state has the highest density of population ?
(i) Haryana
(ii) U.P.
(iii) Bihar
(iv) Kerala
Ans.— (iii) Bihar.
Q. 5. Which state has the highest sex ratio ?
(i) Kerala
(ii) Himachal
(iii) Orissa
(iv) Tamil Nadu
Ans.— (i) Kerala.
Q. 6. Where does India rank in world population ?
(i) First
(ii) Second
(iii) Fifth
(iv) Seventh
Ans.— (ii) Second.
Q. 7. The growth of population rate per decade is :
(i) 15.3%
(ii) 17.3%
(iii) 1.7%
(iv) 21.3%
Ans.— (iii) 1.7%.
Q. 8. When was first census held in India ?
(i) 1871
(ii) 1881
(iii) 1891
(iv) 1861.
Ans.— (ii) 1881.
Q. 9. How much per cent of World population have in India ?
(i) 10.7%
(ii) 12.7%
(iii) 16.7%
(iv) 18.7%
Ans.— (iii) 16.7%.
Q. 10. Which State has the lowest population ?
(i) Punjab
(ii) Sikkim
(iii) Assam
(iv) Rajasthan.
Ans.— (ii) Sikkim.
II. Fill in the blanks
1. Total population of India according to 2011 census was……… .
2. Number of ………. years. in a year per 1000 people is called Death rate.
3. There are …….. million plus towns in India.
4. …….. state has the lowest population.
5. ……… state has highest sex ratio.
6. Life expectancy in India is …….. year.
7. India may overtake china’s population in …….. year.
8. Population is greater than …… times than occupied area by India.
Ans.— 1. 121.02 crore, 2. Deaths, 3. 53, 4. Sikkim, 5. Kerala, 6. 66.5 7. 2045, 8. 7.
III. True/False
1. Migration is the movement of people from one area to another.
2. Kargil has a density of 10 persons per sq. km.
3. Ladakh is a border and isolated area.
4. The natural growth is expressed as percentages.
5. India ranks first in the world population.
Ans.— 1. √, 2. √, 3. √, 4. √, 5. X.
Very Short Answer Type Questions
Q. 1. What was total population of India in 1901 ?
Ans.— 23.60 crores.
Q. 2. What is the total population of India in 2011 ?
Ans.— 121.02 crores (16.7% of world population).
Q. 3. Which year is known as ‘great divide’ in the history of population of India?
Ans.— Year 1921.
Q. 4. Where does India rank in the world population ?
Ans.— Second.
Q. 5. What is male and female population of India ?
Ans.— Males 62 crores (51.7%) and Female 59 crores (48.2%).
Q. 6. After how many years, census is held ?
Ans.— After 10 years.
Q. 7. What is the average density of population in India ?
Ans.— 382 persons per sq. km.
Q. 8. What is the percentage of urban population in India ?
Ans.— 31.2 in 2011.
Q. 9. How many towns are million towns in India ?
Ans.— 53 in 2011.
Q. 10. What is sex ratio in India ?
Ans.— 940 females per 1000 males in 2011.
Q. 11. Which state has highest sex ratio ?
Ans.— Kerala (1084).
Q. 12. Which U.T. has highest sex ratio ?
Ans.— Pondicherry (1038).
Q. 13. What is literacy rate in India ?
Ans.— 74.04% in 2011.
Q. 14. Which state has the highest literacy rate in India ?
Ans.— 93.91% in Kerala.
Q. 15. What is life expectancy in India ?
Ans.— 66.5 years.
Q. 16. What is the full form of NPP ?
Ans.— National Population Policy.
Q. 17. Which state has the highest density of population ?
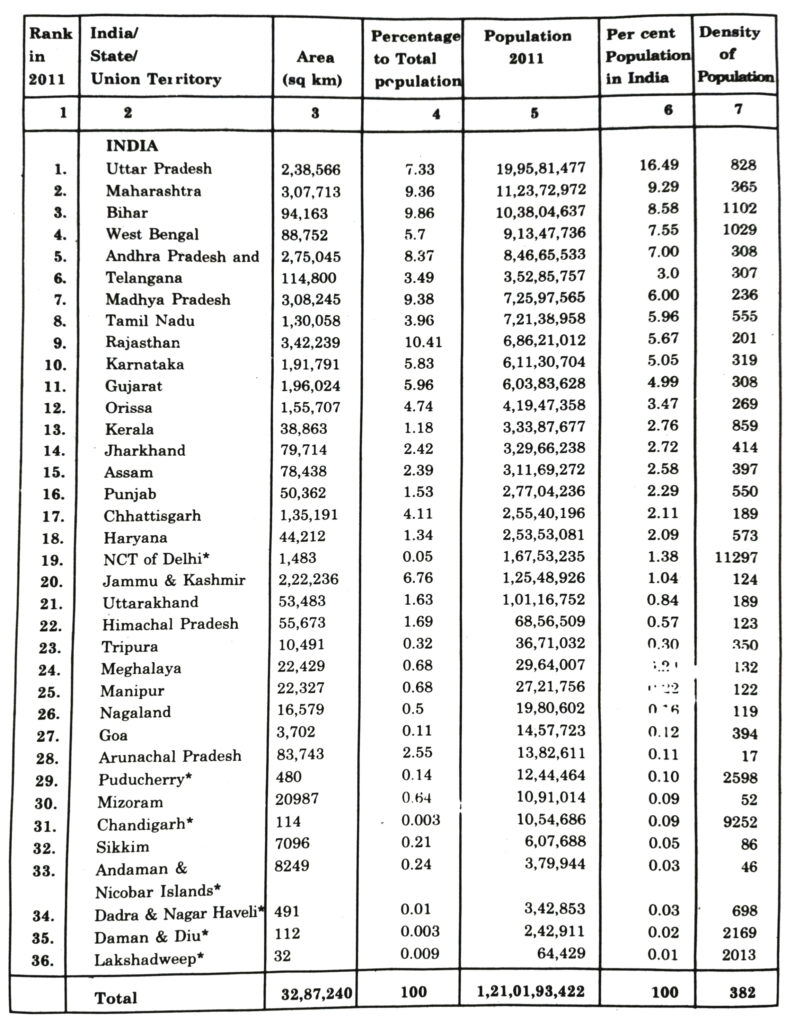
Ans.— Bihar-1102 persons.
Q. 18. Which state has the lowest population density ?
Ans.— Arunachal Pradesh-17 persons.
Q. 19. Which state has the largest population ?
Ans.— Uttar Pradesh-20 crores approx (16% of total).
Q. 20. In which year, India may overtake China’s population ?
Ans.— 2045.
Q. 21. Describe the Occupational structure in brief.
Ans.— Occupational structure refers to the aggregate distribution of occupations in society according to skill level and economic functions etc.
Q. 22. What is meant by a literate person ?
Ans.— A literate person is a person who is unable to read and write or ignorant about a certain subject.
Short Answer Type Questions
Q. 1. Which state in India has the largest population and the highest density of population? How long will it take to double the population of India ?
Ans.— According to 2011 census, Uttar Pradesh has the largest population in India. It has a total population of 19,95,81,477 persons. It is about 16% of total population of India.
The highest density of population is found in Bihar. It has density of 1102 persons per sq. km.
At present growth rate of population (19.3%), the population of India will be double in 35 years.
Q. 2. Which areas of India have a very low density of population and why ?
Ans.— Due to adverse environmental conditions, density of population is low over the hilly states of North and North-East. The densities are as low as 86 in Sikkim, 120 in Nagaland, 124 in J & K, 132 Meghalaya, 122 in Manipur, 17 in Arunachal, 52 in Mizoram and 123 in Himachal Pradesh. In these areas hilly terrain, low temperature, lack of means of transport and unfavourable climate have a great influence.
Q. 3. “The sex ratio has been generally declining ever since 1901”. Critically examine the statement and give reasons for the declining trend.
Ans.— The sex ratio of India is 940 per thousand males. There is a general declining trend in sex ratio. The ratio in 1901 was 972. It was declined to 940 in 2011. This decline has been due to social evils in our society.
In our society, female child is neglected. Male population dominates in our society. There is high death rate among females. Death rate is particularly high among married women. Women labour migrates to more mining and industrial centres. It also results in declining sex ratio.
Q. 4. What is Census ? After how many years is it held in India ?
Ans.— The Census is a count of population of a country. In India, it takes place after every ten years. The last census was held in 2011. The census is an enquiry based on a questionnaire. The questions relate to various kinds of information about the members of the households. The questions are not only related to age and occupations of people, but also to the type of facilities available in the households. On the basis of this information, the government provides details about births, deaths, migration, literacy, sex-ratio and age structure of the population.
Q. 5. Population is the pivotal element in Geography. Explain.
Ans.— Population is the pivotal element in Geography. It is the point of reference from which all other elements are observed and from which they derive significance and meaning. Hence, “Resources”, “calamities”, and “disasters” are all meaningful only in relation to human beings.
Human beings are the producers and consumers who utilise the earth’s resources. Their numbers, distribution, growth and characteristics or qualities provide the basic background for understanding and appreciating all aspects of the environment.
Q. 6. Describe India’s population distribution by density.
Ans.— India’s population distribution by density.
Population density provides a better picture of the uneven distribution. Population density is calculated as the number of persons per unit area. India is one of the most densely populated countries of the world. Only Bangladesh and Japan have higher average population densities.
The average population density of India in the year 2011 was 382 persons per sq. km and varies from, 1102 persons per sq. km in Bihar to only 17 persons per sq km in Arunachal Pradesh.
Q. 7. Should India feel proud of its (a) size (b) total population (e) average density of population (d) none of these? Give reasons.
Ans.— India cannot be proud of its size, total population and average density of population. As regards its area India ranks 7th in the world with 2.3% of the total area of the world. There is a high pressure of population on land. Per capita cultivated land is only 0.29 hectare.
As regards total population, India with 103 crores of people, ranks second in the world. But this huge manpower is not efficient, talented, and qualitative. The average density of population is 324 persons per sq. km. It puts a huge pressure of population on land. So India is proud of none of these.
Q. 8/9. Write a note on Mangrove forests.
Ans.— Mangrove forests are found in Delta regions. As a tree named Sundari is found in these forests, they are also called Sunderbans. These forests are mainly found in the Delta regions of the Ganges, Brahamputra, Kaveri, Krishna and Mahanadi rivers. These forests are woody plants that form the dominant vegetation. These forests are characterized by their, prop roots, their ability to handle regular inundation by salt water, pre dispersal, germination of the seeds.
COMPARISON TYPE QUESTIONS
Q. 1. Distinguish between birth rate and growth rate.
Ans.—
| Birth rate | Growth rate |
| 1. The number of live births per thousand persons during a certain period of times is called birth rate. | 1. It is the difference between the birth rate and death rate per 1000 persons. |
| 2. It is calculated for every 1000 persons for a year. | 2. The growth rate of population is expressed as percentage during a certain period of time. |
| 3. A high birth rate shows an increasing population. | 3. When birth rate is more than death rate, it shows a positive growth rate. |
Q. 2. Distinguish between total population and density of population.
Ans.—
| Total population | Urban population. |
| 1. Total population is the actual or absolute number of persons living in a country. | 1. Manufacturing and trade are the main occupations of urban people. |
| 2. Total population of India was 121.02 crores in 2011. | 2. The urban population is provided with all the basic facilities of life. |
| 3. Total population is counted during a census generally conducted after 10. | 3. The density of population is high in urban areas. |
Q. 3. Distinguish between rural population and urban population.
Ans.—
| Density of population | Rural population |
| 1. Density of population is the ratio between the total number of people and the total area of the land. | 1. Agriculture is the main occupation of rural people. |
| 2. The density of population in India was 382 persons per sq. km in 2011. | 2. The rural population is not provided with modern facilities. |
| 3. Density of population is expressed as average number of persons per sq. km or mile. | 3. The density of population is low in rural areas. |
Ranking Of States and Union Territories by population 2011 :
Note : India has 28 States and 8 Union Territories now.
Long Answer Type Questions
Q. 1. “The spatial distribution of population in India is highly uneven.” Discuss with the help of suitable examples.
Or
Write an essay on population distribution in India.
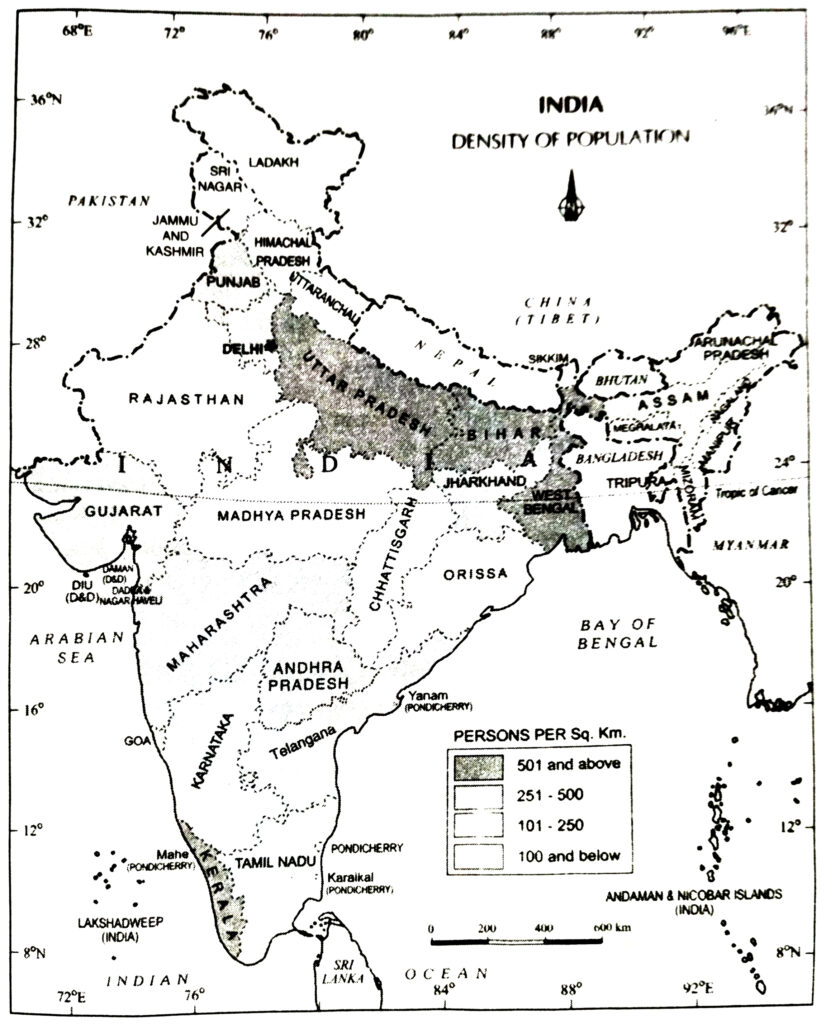
Ans.— The distribution of population in India is very unequal. According to 2011 census the total population of India is 121.02 crores and the density of population is 382 persons per sq. kilometre. The density of population varies according to relief, climate and the agricultural productivity of the land. The density of population depends on the amount of rainfall. The areas of sufficient rainfall can support a large number of people.
1. Densely populated areas : These areas have a density of more then 500 persons per sq. kilometre. The high density areas makes a girdle round the Deccan plateau. Right from Sutlej-Beas plain to Brahmaputra valley, the density of population is very high.
(a) West Coastal Plain : Kerala has 859 persons per sq. kilometre density of population.
(b) The East Coastal Plain : Tamil Nadu has a density of 555 persons per. sq. kilometre.
(c) The Northern Plain : It includes West Bengal (1029), Bihar (1102), Uttar Pradesh (828), Punjab (550).
Factors favouring high density :
(1) Sufficient rainfall.
(2) Fertile river valleys and deltas.
(3) 2 to 3 crops of rice in a year.
(4) Healthy climate.
(5) Rich in mineral and power resources.
2. Moderately populated areas : These include the areas with a density between 200 to 500 persons per sq. kilometre. These areas are surrounded by Eastern Ghats and Western Ghats. Haryana (573) Maharashtra (365), Andhra Pradesh (308), Karnataka (319), Gujarat (305), Orissa (269), Goa (399), Assam (397) have a moderate density.
Factors for moderate density :
(1) Agriculture is not developed due to thin and rocky soils.
(2) Rainfall is uncertain.
(3) Means of transportation are not developed.
(4) Some areas have high density of population due to irrigation, lava soils and mineral resources.
3. Sparsely populated areas : These areas have a density less than 200 persons per sq. kilometre.
(a) North Eastern India : This region includes Meghalaya (132), Manipur (122), Nagaland (120), Sikkim (86) and Arunachal (17).
(b) Rajasthan Desert : Rajasthan has a density of 165 persons per sq. kilometre.
(c) Western Himalayas : It includes Jammu and Kashmir (99), Himachal Pradesh (109).
Factors for low density :
(1) The hilly nature of the land.
(2) Dense forests.
(3) Low rainfall.
(4) Poor economic development.
(5) Absence of minerals.
(6) Lack of irrigation and agriculture.
(7) Cold climate.
Q. 2. Find out the implications of high density of population in India.
Ans.— The rapid growth of population has posed many socio-economic problems in different countries. The main problems are :
1. Food problem : Growth of population has led to shortage of foodgrains in many areas.
Agriculture production has increased due to new technology, yet many countries have to import agricultural products.
2. Housing problem : Housing conditions are poor in over-populated countries. People live in slum areas. Skyscrapers are being built in many Metropolitan towns.
3. Unemployment : Rapid increase in population leads to unemployment. Migration of people from over-populated rural areas has added to unemployment.
4. Low standard of living : Per capita income is low in overcrowded areas, so living conditions are poor. People do not afford to have basic necessities of life. Population explosion leads to poverty and a poor standard of living.
5. Dependent population : A large percentage of young people become dependent on a small working population.
6. Social problems : Many social problems arise due to over-crowding. Poor health, and bad sanitary conditions lead to epidemics.
Q. 3. Describe the size and growth rate of population, distribution in J & K state.
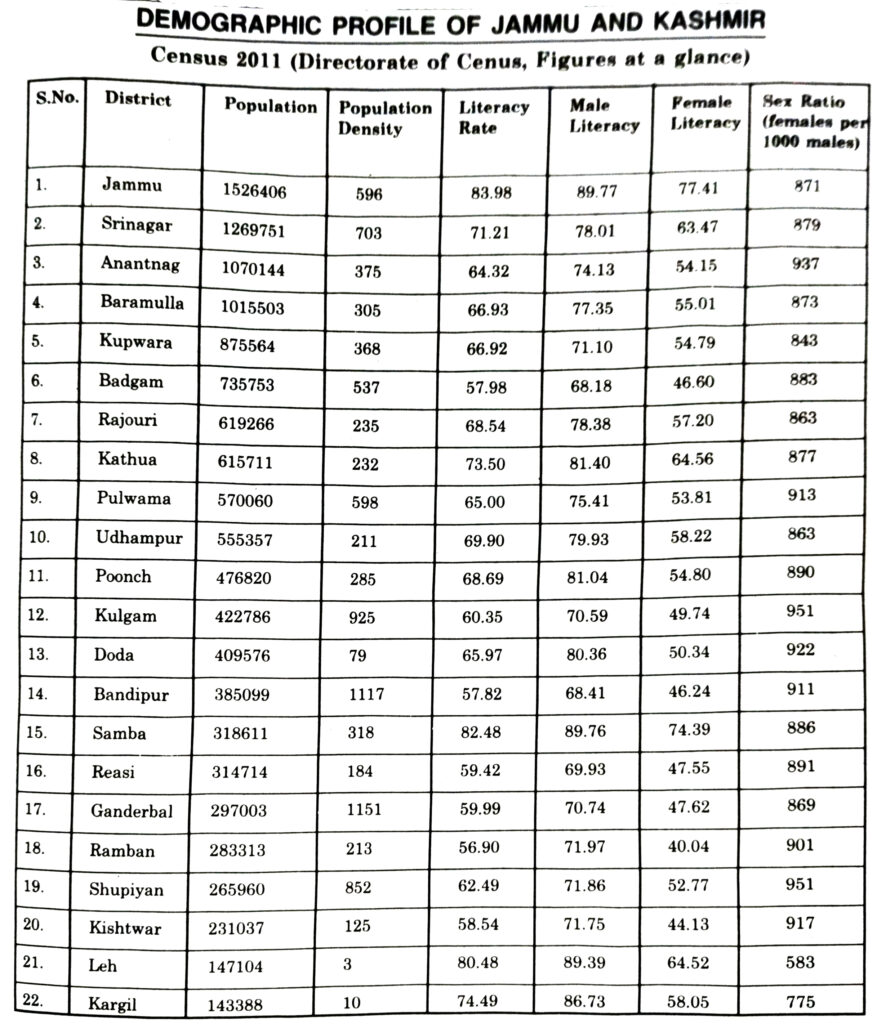
Ans.— Population of Jammu and Kashmir Size andGrowth Rate : As per the Census of 2011, the total population of Jammu and Kashmir is 1,25,48,926. In the previous Census, the total population of the state was in a period of ten years about 25 lakh people of the State. 1,00,69,917. Thus,
Among various district, Jammu stands at number one position with total population of 15.26 lakh. The population of the state is growing at a faster rate with the national average. The Present decadal growth rate is 23.71% while the national growth rate is only 17.64%. The increase in population may be attributed to the declining death rate and constant high birth rate. The medical service has been extended to the rural areas as a result of which the death rate has decline substantially.
Population Distribution
The spatial distribution of population in Jammu and Kashmir is highly uneven. The physical factors like terrain, topography, shape, climate, drainage, soil, natural vegetation, mineral resources and accessibility have largely controlled the distributional pattern of population in the state. The distribution of population differs from district to district and from micro to macro regions. The highly populated district is Jammu with total population of 15,26,406 and the least populated district is Kargil with 1,43,388 people.
Density of Population
Like distribution of population density of population (Land men ratio) also varied from area to area and district. In comparison to the national average density of 382, the density of population in the state of Jammu and Kashmir is low. It increased from 100 persons per square kilometer to 124 persons per square kilometer. It can be mainly attributed to hilly terrain and strategic location.
Highest density is in Ganderbal with as many as 1151 persons living per square kilometer and on the other extreme Leh district has the lowest density of the 3 persons per sq. km.
Demographic Attributes
A very significant attribute of population is sex ratio. According the Census of 2011, the sex ratio in the state is 883 females per 1000 males while in the previous census of 2001 it was 892 females per 1000 males. It is a matter of great concern at state and national levels.
Another important attribute of population is literacy rate which is 68.74% Males and females show different literacy rate. In J&K state 78.26% males are literate while female literacy rate is only 58.01%. Low female literacy rate is because of various factors mainly low level of awareness, religious ideology, low status of women, poverty, distance from the school etc.
MAP SKILLS
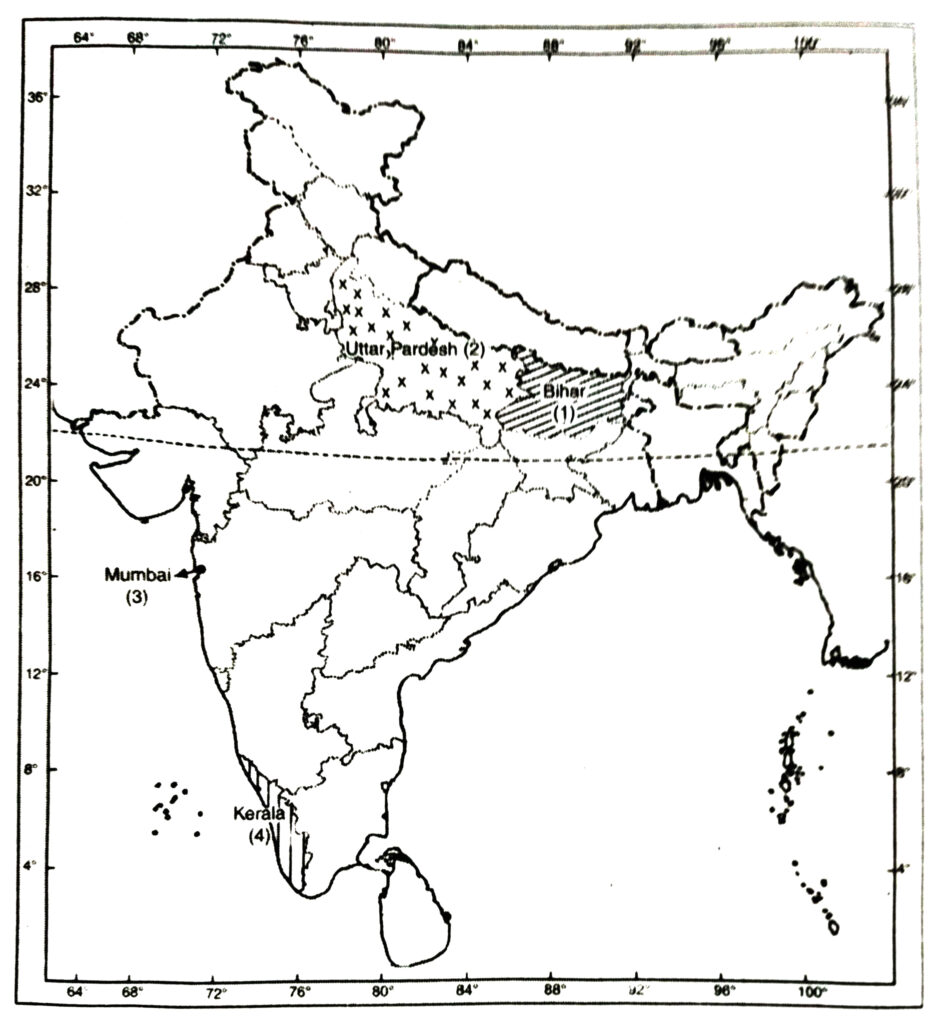
Q. On the outline map of India mark and label the following.
1. A state with highest density
2. A state with largest population
3. A town with 1 crore population
4. The state with highest literacy rate.
Ans.—
PROJECT/ACTIVITY
Q. 1. Study the figure showing growth of population in India and answer the following questions.
(i) What is the total population of India in 2011 ?
Ans.— More than 121 crores.
(ii) Which year is known as great divide in Indian population ? Why.
Ans.— 1921 Because the population started increasing afterwards.
(iii) How much percentage area of world is occupied by India ?
Ans.— 2.4%.
(iv) How much percentage of population of world is occupied in India ?
Ans.— 16.7%.
(v) How many times population is greater than occupied area by India ?
Ans.— Almost 7 times.
Q. 2. Study the diagram given below and answer the following questions.
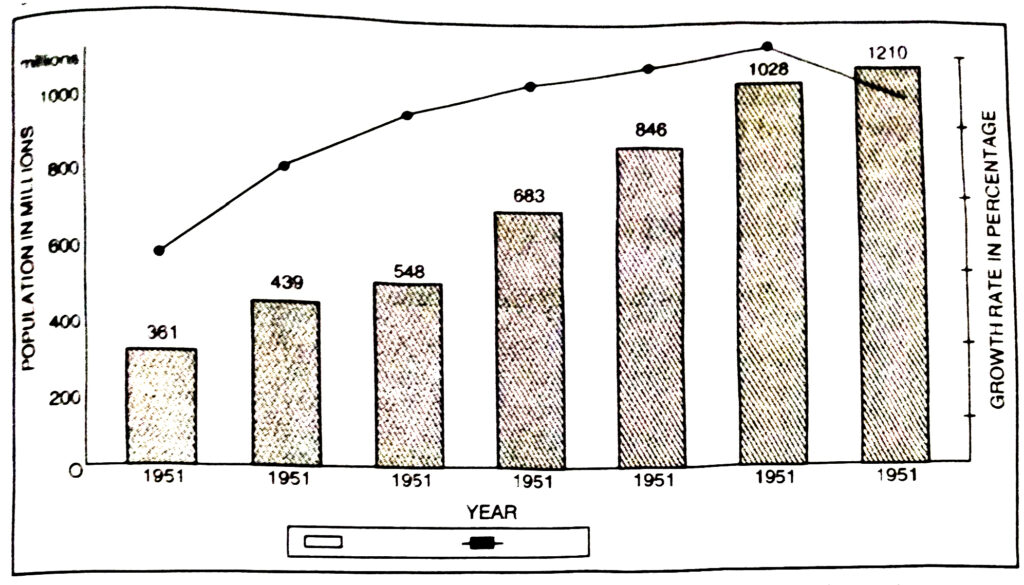
(i) How much population has been added during decade 2001-2011 ?
Ans.— 1210-1028 = 182 million.
(ii) How many times the population has increased from 1951 to 2001 ? (50 years)
Ans.— Three times.
(iii) When was the growth rate maximum ?
Ans.— In 1981 more than 2%.
(iv) What is the reason for declining growth rate ?
Ans.— Declining birth rate.
Follow on Facebook page – Click Here
Google News join in – Click Here
Read More Asia News – Click Here
Read More Sports News – Click Here
Read More Crypto News – Click Here